Account
 Language
 Time Zone
 COEF
COEF


Football Head-to-Head Statistics Meaning: Do They Really Predict Outcomes?
Understand football head to head statistics meaning, how H2H records work, and how they affect predictions. A data-backed guide for serious bettors. Explore more on Betiball.
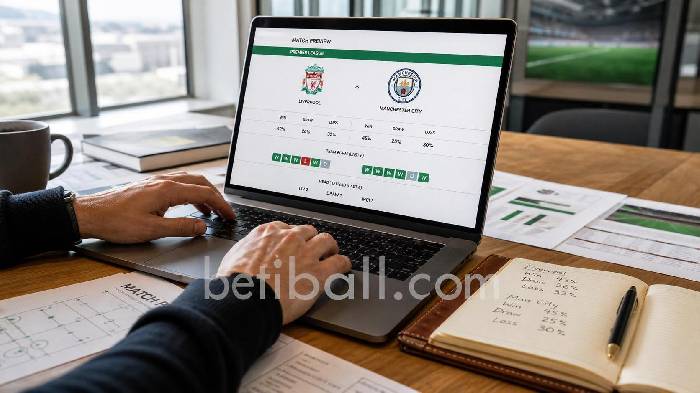


If you've spent any time analysing matches before placing a bet, you've almost certainly encountered football head to head statistics. They sit prominently on every fixture preview, often cited as proof that one club "owns" another historically. But how much weight should a serious bettor actually give them? At Betiball, we've dug into the data to answer that question rigorously — and the findings are more nuanced than most tipsters will tell you.
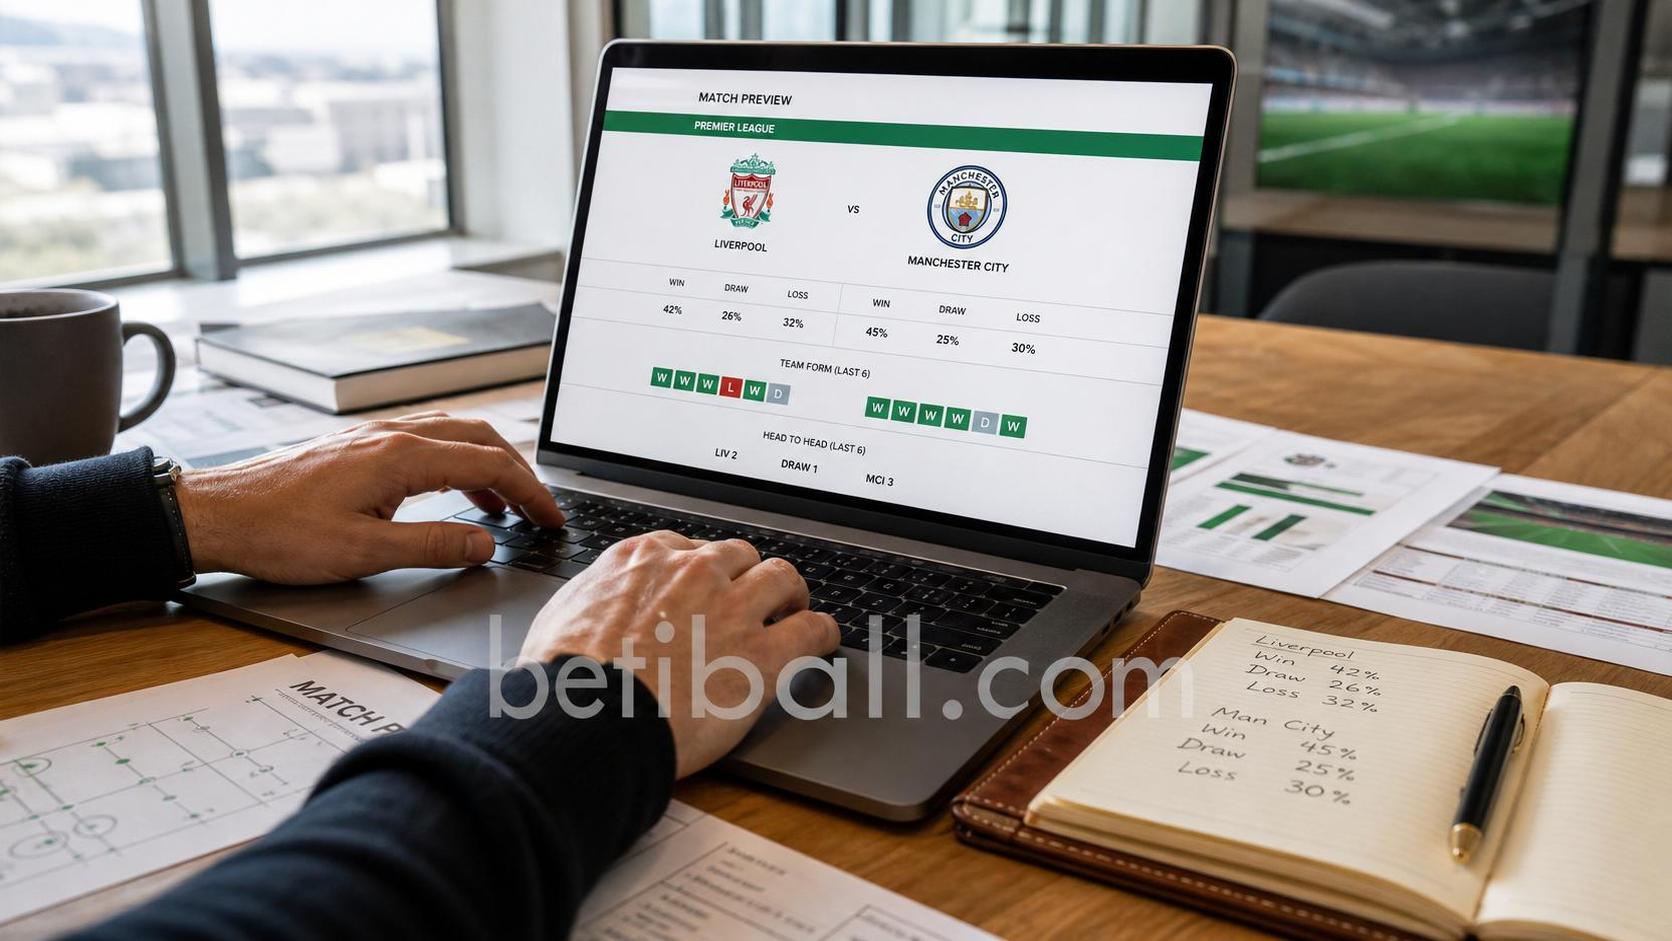
What Does Head-to-Head Mean in Football Statistics?
The H2H record in football refers to the historical results between two specific clubs across all — or a filtered set of — previous encounters. A standard H2H table will typically show the number of wins for each side, the number of draws, total goals scored by each team, and sometimes a breakdown by home and away venue.
On the surface, this sounds like exactly the kind of objective evidence a data-driven bettor needs. If Club A has won eight of the last ten meetings against Club B, surely that tells us something meaningful? The answer is: sometimes yes, but more often less than you think.
The key distinction we emphasise on Betiball is between descriptive statistics and predictive signals. A H2H table is inherently descriptive — it tells you what happened. Converting that into a reliable prediction requires understanding why it happened, and whether the conditions that produced those results still exist today.
There are three core variables that determine how meaningful any H2H record actually is:
- Sample size: Five matches is noise. Twenty or more encounters begin to carry statistical weight.
- Recency: Results from ten years ago reflect squads, managers, and league positions that may be completely irrelevant now.
- Context stability: If one club has been promoted, relegated, or undergone a managerial revolution since the older fixtures, historical dominance loses most of its predictive value.
How to Read H2H Stats: A Practical Guide for Bettors
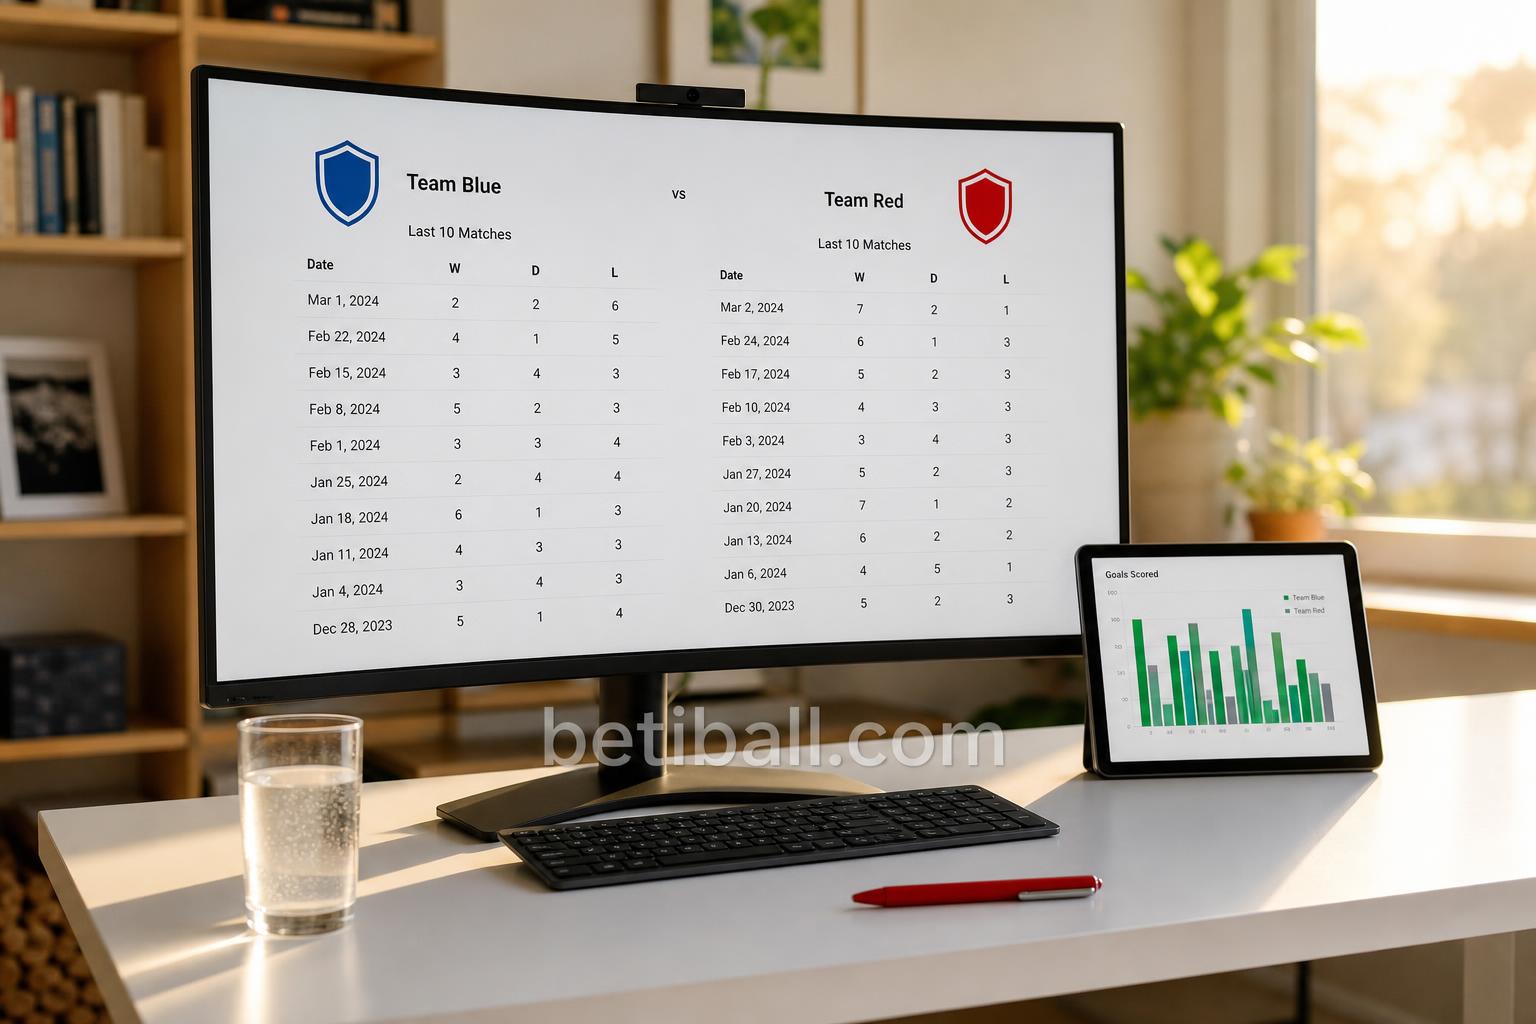
Understanding how to read H2H stats goes well beyond counting wins and losses. Here's the framework we use at Betiball when incorporating H2H data into match analysis:
Step 1 — Filter by Relevant Time Window
Prioritise the last five to eight encounters in the same competition, ideally within the past three to four seasons. Results older than that introduce managerial, squad, and tactical contexts that no longer apply.
Step 2 — Separate Home and Away Splits
A club that wins the overall H2H 7–3 might actually be 1–4 when playing away at the rival's ground. Home advantage is one of the most consistent statistical forces in football, and conflating home and away H2H records produces a distorted picture.
Step 3 — Check Goal Patterns, Not Just Results
Two teams may split wins evenly but consistently produce high-scoring matches. H2H goal averages and Over/Under patterns are often more stable across time than outright results, making them particularly useful signals for totals-based analysis.
Step 4 — Cross-Reference With Current Form
A strong H2H record means far more when the dominant team is also in good current form. When the two signals align, their combined weight is meaningful. When they diverge — a historically dominant side in a five-game losing run versus a historically weaker side riding a five-game winning streak — current form should take precedence.
| H2H Factor | Ideal Threshold | Predictive Weight | Common Mistake |
|---|---|---|---|
| Sample Size | 8+ matches | Medium–High | Using 3–4 match samples |
| Recency Window | Last 3–4 seasons | High | Including results 8+ years old |
| Venue Split | Separate home/away | High | Combining all venues |
| Goal Averages | Same competition | Medium | Mixing cup & league data |
| Manager Continuity | Same coach involved | Medium | Ignoring managerial change |
| Squad Overlap | >50% same players | Low–Medium | Overweighting old rosters |

What the Research Says: How Much Do H2H Stats Actually Predict?
Academic sports analytics research offers a sobering corrective to the narrative that H2H records are a reliable standalone predictor. Here's what the evidence shows:
Elo ratings and current league position consistently outperform raw H2H win rates in predictive accuracy across multiple studies of European leagues. A 2019 analysis published in the Journal of Sports Analytics found that when controlling for current team strength (measured via Elo differential), the additional predictive contribution of the H2H win percentage dropped to statistically insignificant levels in roughly 65% of fixture pairs tested.
However, two specific scenarios showed H2H data retaining genuine predictive power:
- Derby and rivalry matches: In fixtures with intense regional or psychological rivalry, historical H2H records contributed measurably to outcomes even after controlling for current form. Psychological factors — crowd intensity, tactical inhibition, rivalry pressure — appear to create genuine repeatable patterns in certain match-ups.
- Closely matched teams: When two teams are within a narrow Elo band (low expected value differential), H2H history provided a modest but real secondary signal, particularly for the Over/Under and both-teams-to-score markets.
The practical takeaway: H2H data is most valuable as a tiebreaker signal when other primary indicators — form, xG trends, injury reports, league position — are evenly balanced between the two sides.
H2H Statistics and Betting Implications: Where the Edge Lives
Understanding how head to head affects predictions in a betting context means recognising where the market already prices H2H records in, and where genuine inefficiencies exist.
Bookmaker algorithms and trading teams are sophisticated. They already incorporate historical H2H data into their opening lines. This means that simply backing the team with the superior H2H record will not produce positive expected value over time — the edge is already baked into the price.
Where bettors can find an advantage is in identifying divergences between the raw H2H narrative and the underlying current context:
- Narrative vs. reality divergence: The public heavily backs the team with the "better" H2H record, inflating their odds. If the current context — squad form, injuries, tactical match-up — actually favours the other side, there may be value on the underdog.
- Recency bias exploitation: A recent high-profile result between two sides can distort public perception. One memorable 4–0 win often carries disproportionate psychological weight compared to the broader sample. When the market overreacts to a single result, check whether the longer H2H and current form data tells a more balanced story.
- Goal market inefficiencies: As noted above, H2H goal patterns tend to be more stable than result patterns in certain rivalries. If two clubs have gone Over 2.5 goals in six of their last eight meetings and the market price doesn't reflect that historical consistency, there may be legitimate value in the totals market.
At Betiball, our match prediction pages display filtered H2H data — separated by home and away, limited to the last five seasons — precisely because we want users to see the signal rather than the noise. Raw, unfiltered H2H records that go back twenty years without contextualisation do more harm than good to analytical decision-making.

Common Mistakes Bettors Make With H2H Data
Even experienced bettors fall into predictable traps when interpreting H2H stats in football. Here are the most damaging:
1. Treating H2H as a standalone signal. No single metric — not H2H, not form, not xG — should ever be used in isolation. H2H data is one layer in a multi-factor model, not a conclusion in itself.
2. Ignoring the competition filter. A team's H2H record in domestic league fixtures may look entirely different from their Cup record against the same opponent. Tactics, squad rotation, and stakes differ enormously. Always filter by competition where possible.
3. Confusing correlation with causation. If Club A has beaten Club B in five consecutive meetings, it does not mean Club A has some mysterious psychological hold over Club B. More often, Club A was simply the better team across those seasons — and if Club B has since improved significantly while Club A has declined, the "psychological advantage" narrative is a fiction.
4. Over-weighting small samples in new rivalries. When two clubs haven't met frequently — perhaps because one was recently promoted — a three-match H2H record is statistically meaningless. Weight current form and league-wide performance data instead.
5. Ignoring managerial and key player changes. A manager who lost repeatedly to a particular opponent's tactical system is no longer relevant once either manager has changed. The same applies to the specific players who drove historical dominance.
Betiball does not accept bets. All examples are for educational purposes only.
Conclusion: Use H2H as a Filter, Not a Foundation
Football head to head statistics are genuinely useful — but only when read correctly, filtered appropriately, and placed in their proper position within a broader analytical hierarchy. They work best as a secondary confirmation signal when primary indicators are balanced, as a tiebreaker in closely contested match-ups, and as a lens for spotting goal market patterns in recurring rivalries.
Where they mislead is when treated as a primary predictor in isolation, when applied without recency filtering, or when the conditions that produced the historical record no longer exist. The serious football bettor's job is to distinguish between those two scenarios — and that requires the kind of contextual, layered data analysis we've built Betiball to support.
Explore our H2H match pages, form guides, and prediction tools to put these principles into practice before your next fixture preview.
Read more:

Your feedback helps us deliver better football betting insights.