Account
 Language
 Time Zone
 COEF
COEF


xA Expected Assists in Football Explained: What It Measures
Discover what xA expected assists football explained means, how the stat is calculated, and why it matters for creative player analysis. Explore more on Betiball.



When analysts talk about creative output in modern football, xA expected assists football explained is a concept that keeps coming up — and for good reason. Expected Assists, or xA, strips away the randomness of whether a shot actually goes in and instead asks a sharper question: how dangerous was the pass that created the chance? At Betiball, we use xA alongside other advanced metrics to build a fuller picture of attacking play, helping serious bettors move beyond surface-level statistics like key passes or assists recorded.

What Is xA (Expected Assists) in Football?
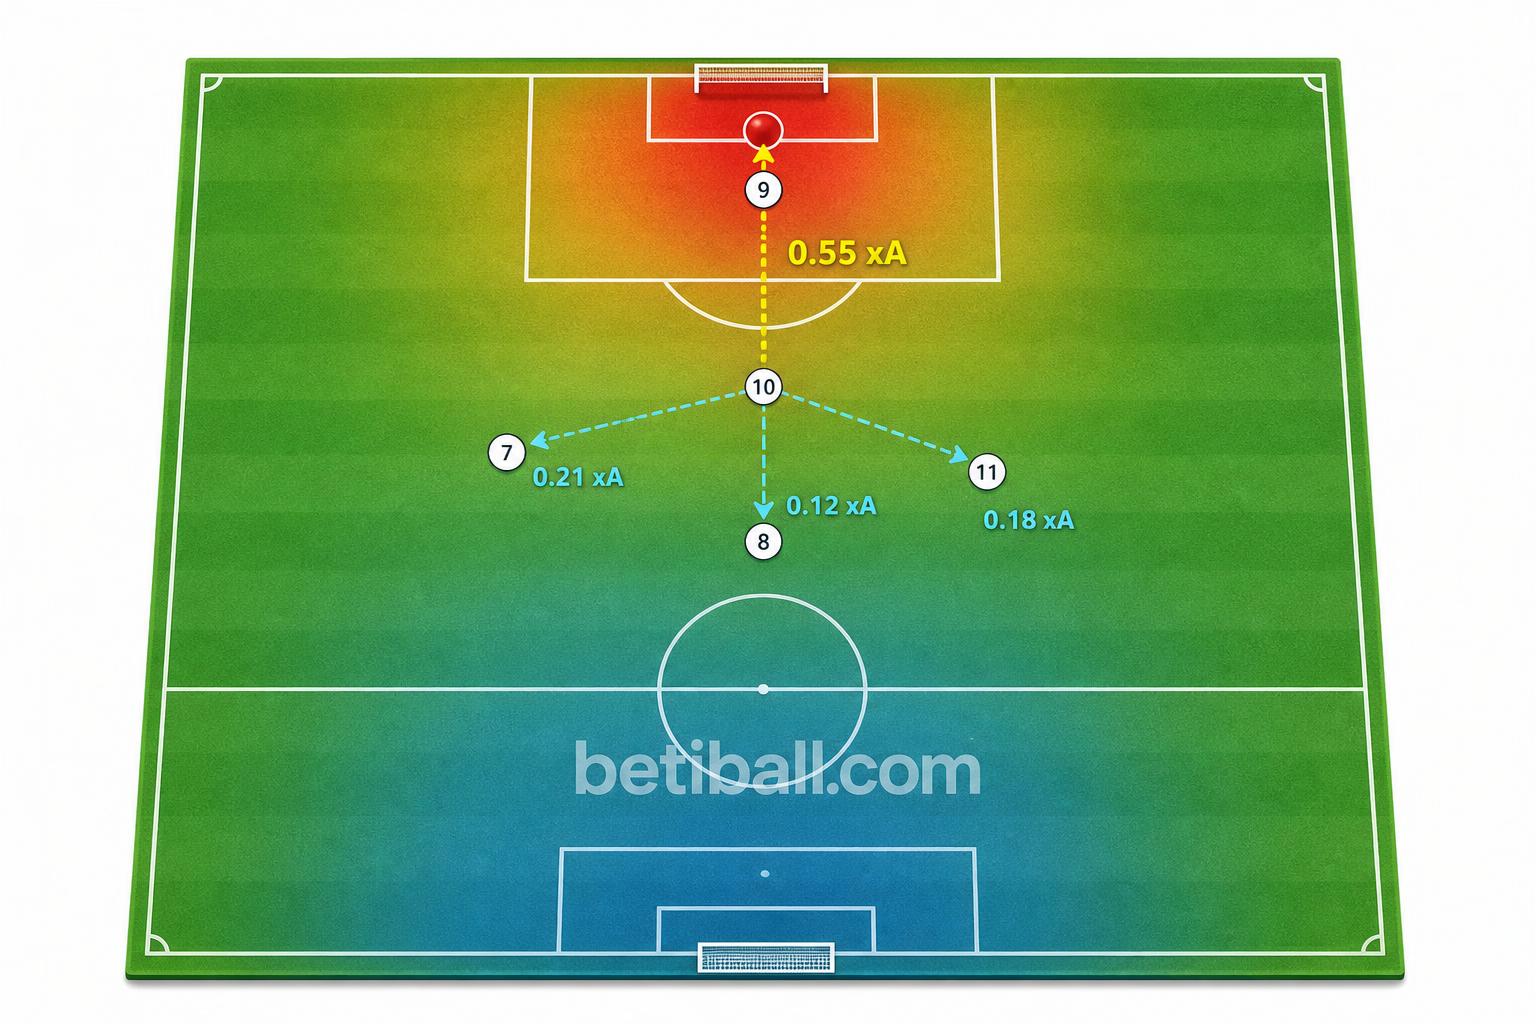
Expected Assists is a statistical model that assigns a probability value to every pass or cross that directly leads to a shot. That value — expressed as a number between 0 and 1 — represents the likelihood that the chance created would result in a goal, assuming average finishing quality. A pass worth 0.30 xA, for example, created a chance that a typical forward would be expected to convert roughly 30% of the time.
The metric was developed as a natural companion to expected goals (xG). Where xG evaluates the shot itself, xA evaluates the action immediately before it. Together, they allow analysts to assess both the creative player and the finisher independently of outcomes they cannot fully control.
Variables that typically feed into an xA model include:
- Pass origin: where on the pitch the pass was delivered from
- Pass type: through ball, cross, cutback, layoff
- Delivery endpoint: exactly where the ball arrived in the danger zone
- Defensive pressure: how many defenders were between the passer and the goal line
- Shot zone reached: the expected goal value (xG) assigned to the resulting shot
In essence, xA borrows the xG value of the shot that followed the pass. If a through ball leads to a one-on-one with the goalkeeper — a shot worth 0.55 xG — then the pass that created it is credited with 0.55 xA.
How xA Is Calculated: The Mechanics Behind the Model
xA is not calculated by the player who makes the pass — it is calculated retroactively from the shot that follows. Here is the step-by-step logic most modern models apply:
- A pass is made that directly precedes a shot attempt (excluding deflections and long rebounds).
- The resulting shot is evaluated using an xG model — taking into account location, angle, distance, shot type, and body part used.
- That xG value is assigned to the pass as its xA score.
- Over multiple matches, a player's cumulative xA builds up, providing a season-long picture of creative contribution.
Some advanced providers — including Opta, StatsBomb, and FBref — apply additional filters. StatsBomb's version, for instance, accounts for whether the goalkeeper was out of position or whether a defender was on the goal line. These refinements make the metric more accurate but can also create minor discrepancies between providers, which is why comparing xA across different data sources requires care.
It is also important to understand that xA only accounts for shot-generating passes. A brilliant switch of play that unlocks the defence but is then overhit by a teammate will not appear in any player's xA tally. This is a known limitation, and one reason why analysts often pair xA with metrics like progressive passes, pass into the final third, and chance creation (pre-assist data).

A Numeric Example: Reading xA in Practice
Let us look at a hypothetical Premier League creative midfielder across a 10-match sample:
| Matches Played | Key Passes | Actual Assists | Cumulative xA | xA Per 90 |
|---|---|---|---|---|
| 10 | 32 | 2 | 6.8 | 0.63 |
This player has 2 recorded assists — a figure that might cause casual observers to dismiss their creative season. But their 6.8 cumulative xA tells a sharply different story. They have consistently created high-quality chances; it is their teammates who have failed to convert. The xA Per 90 of 0.63 would rank among the top creative players in most European leagues.
Now flip the scenario. A player with 7 actual assists but only 3.1 xA has been the beneficiary of exceptional finishing by teammates. Their assist tally is likely to regress as the season continues. For bettors placing player props on assists or creative contributions, this distinction is enormously valuable.
This is precisely why we surface xA data at Betiball — raw assist counts can be deeply misleading, but xA gives you a stable, repeatable signal of creative quality.
When to Use xA in Your Analysis
xA is most powerful in specific analytical contexts. Here is where we recommend applying it:
Evaluating Creative Player Performance Over Time
A sample of at least 8–10 matches is needed before xA becomes statistically meaningful. Over a full season, it is one of the most reliable indicators of a player's true creative output, independent of their team's finishing quality.
Identifying Regression Candidates
When a player's actual assists significantly outpace their xA, regression is likely. The reverse is equally true — a player with high xA and low actual assists may be due an uptick if their team's conversion rate normalises.
Assessing Team-Level Creativity
Aggregated team xA figures highlight which sides create dangerous chances routinely versus which teams ride on clinical finishing. A team with high team xA but moderate goals scored may be underperforming their attack; one with low xA but many goals may be overperforming and vulnerable in future fixtures.
Comparing Creative Players Across Different Teams
Because xA isolates the quality of the pass itself from the finisher's ability, it allows fair cross-team comparisons. A midfielder playing for a poor-finishing side can still rank highly on xA despite minimal assists — a nuance traditional statistics completely miss.
Common Mistakes When Interpreting xA Football Stats
Even experienced analysts misuse xA. Here are the errors we see most frequently:
- Treating xA as a perfect predictor: xA is a probability model, not a guarantee. A player with 0.8 xA on a cross still had a 20% chance of not generating a goal — variance is real.
- Ignoring sample size: Three or four matches of xA data are essentially noise. Patterns only become meaningful across larger samples.
- Confusing key passes with xA: A player can generate 10 key passes with low combined xA if those chances are low-quality shots from distance. Volume of creation and quality of creation are different things.
- Ignoring pre-assists: Some of the best creative players in the world specialise in the pass before the assist — actions that generate zero xA despite being central to the chance. Relying exclusively on xA can undersell deep-lying playmakers.
- Using xA in isolation: No single metric tells the full story. At Betiball, we always recommend cross-referencing xA with xG, progressive passes, and defensive pressure data for a complete creative player profile.
Betiball does not accept bets. All examples are for educational purposes only.
Putting xA to Work in Your Football Analysis
Expected Assists is not a magic number — but it is one of the clearest windows we have into the true creative quality of a football player or team, stripped of the noise that comes from variable finishing. When a player's xA and actual assists are misaligned, that gap represents an opportunity: either a regression trade or an undervalued creative contributor the market has not yet priced correctly.
Understanding how xA is built, what it measures, and where its limits lie is the difference between using data as decoration and using it as a genuine analytical edge. Explore our full suite of advanced football statistics — including live xA tracking — on Betiball to sharpen every analysis you make.

Read more:

Your feedback helps us deliver better football betting insights.