Account
 Language
 Time Zone
 COEF
COEF


What Is xG in Football? Expected Goals Explained Simply
Discover what xG means in football, how expected goals are calculated, and how to use them in match analysis. Explore more on Betiball.



If you've spent any time reading football analysis or browsing stats platforms, you've almost certainly come across the term xG. But what is xG in football, exactly — and why does it matter for how you understand the game? At Betiball, we use expected goals as one of the core metrics powering our match statistics and predictions. In this guide, we break down the xG meaning in football, how it's calculated, and how serious analysts use it to cut through noise and find real insight.
What Does xG Mean in Football?
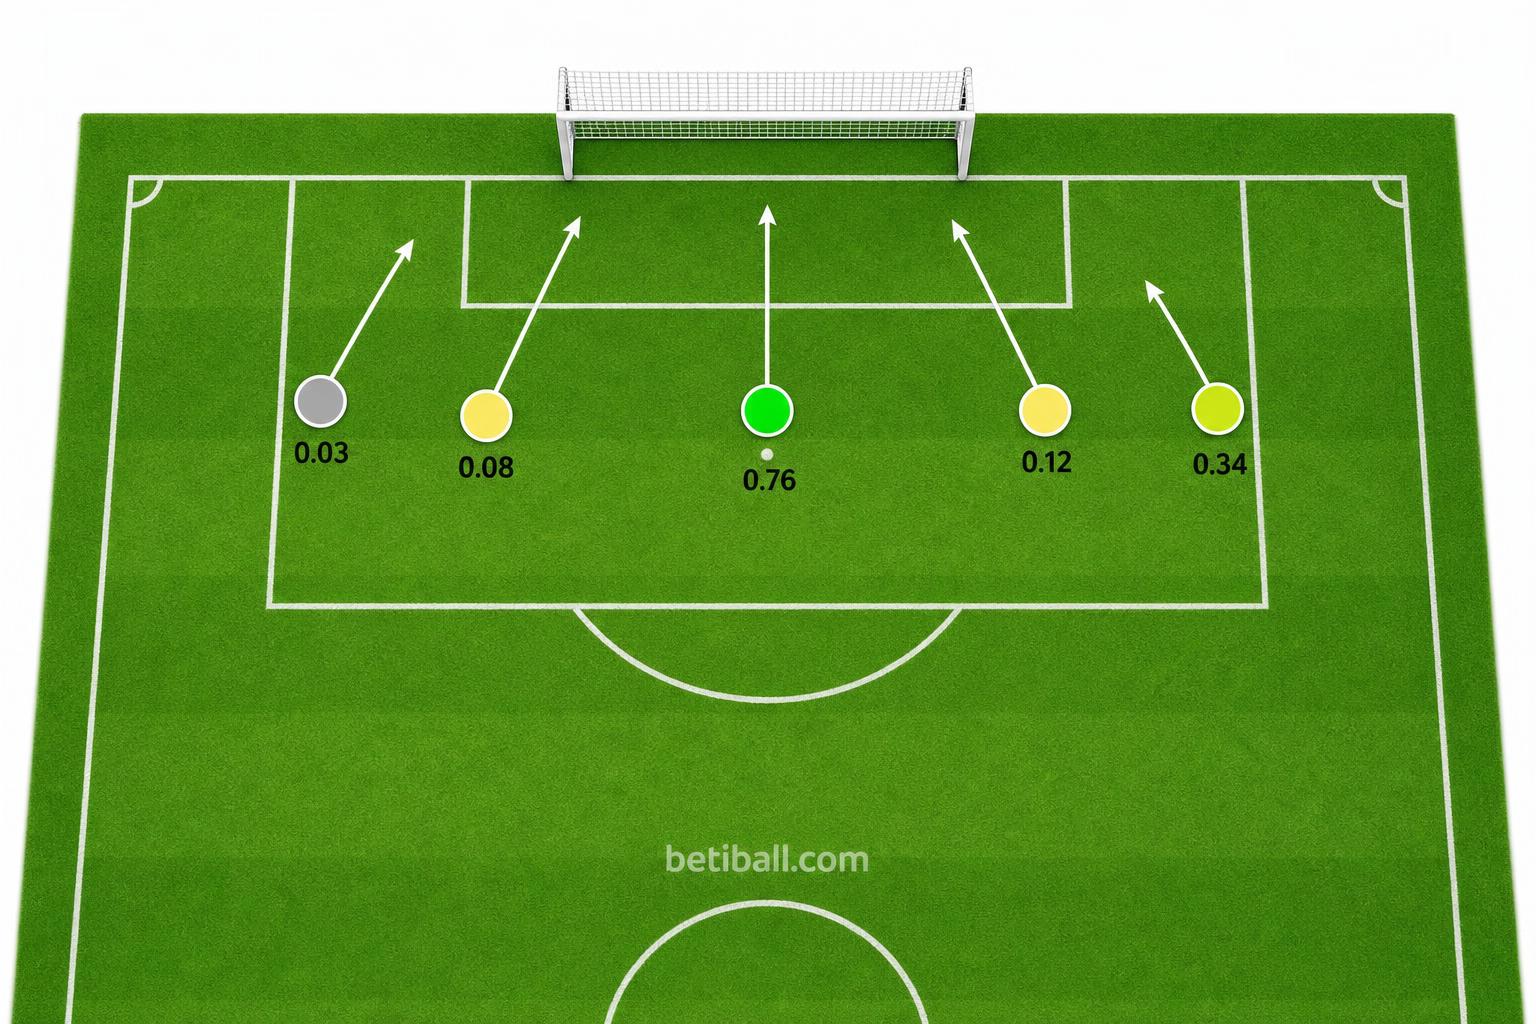
xG stands for Expected Goals. It is a statistical metric that measures the probability of a shot resulting in a goal, based on a range of historical and contextual factors. Rather than simply counting how many shots a team takes, xG assigns each shot a value between 0 and 1 — where 0 means virtually no chance of scoring and 1 means an almost certain goal.
Think of it this way: if a player takes a penalty, historical data tells us that penalties are converted roughly 76–80% of the time. That shot would receive an xG value of approximately 0.76. A header from 25 yards under pressure, on the other hand, might receive an xG of just 0.02 — a 2% chance of finding the net.
Add up all the xG values from every shot a team takes in a match, and you get the team's total xG for that game. This cumulative figure tells you how many goals that team should have scored, based on the quality of the chances they created — not just luck or individual brilliance on that single occasion.

How Is xG Calculated in Football?
The xG model is built on large datasets of historical shots — typically tens of thousands of attempts collected across multiple seasons and competitions. Each shot in the dataset is tagged with a set of variables, and a machine learning or logistic regression model is trained to predict the probability of a goal from those inputs.
The most common variables used to calculate xG include:
- Distance from goal: Shots taken closer to the goal have higher xG values. A tap-in from two yards out carries far more probability than a speculative effort from 35 yards.
- Angle of the shot: A central position in front of goal creates a much larger scoring window than a tight angle from the byline. Models quantify this precisely.
- Shot type: A headed attempt generally has a lower conversion rate than a shot with the dominant foot. Weak-foot shots often carry a slight penalty depending on the model.
- Assist type: Was the shot preceded by a through ball, a cross, or a key pass? A chance created by a cut-back from the byline historically converts at a higher rate than one from a long diagonal ball.
- Game state and pressure: Some advanced models include whether the shot was taken under defensive pressure or in open space, and whether the attacking player had prior touches to control the ball.
Different data providers — StatsBomb, Opta, Understat — use slightly different variable sets and training data, which is why you may see marginally different xG figures across platforms for the same match. At Betiball, we aggregate and contextualise these figures to give you a reliable, consistent view of shot quality across competitions.
A Numeric Example: Reading xG in a Real Match Context
Let's walk through a practical example to make the xG meaning in football fully concrete.
Imagine Team A versus Team B ends 1–0 to Team A. On the surface, that looks like a dominant result. But look at the xG data:
- Team A xG: 0.74 — Their only goal came from a long-range deflected effort that had an xG of 0.04. Their remaining shots were low-quality attempts from wide positions.
- Team B xG: 2.31 — They hit the woodwork twice, missed an open header, and had a clear penalty appeal waved away. Their shots were predominantly from high-probability zones in and around the six-yard box.
The scoreline says Team A won comfortably. The xG data tells a radically different story: Team B dominated the match in terms of genuine chance creation and were extremely unlucky not to win by two or three goals. If these teams played the same match ten times over, Team B would be expected to win the majority.
This is the real power of expected goals explained simply: it separates performance from outcome. Over a single match, variance and goalkeeper brilliance can distort results. Over 10 or 20 matches, xG becomes one of the most reliable predictors of future performance available.

When Should You Use xG in Football Analysis?
Expected goals is not a perfect metric — no single number ever captures the full complexity of a football match. But used correctly, it is one of the most actionable tools in serious football analysis. Here is when xG adds the most value:
Evaluating form over a sample of matches. A team on a three-game losing streak with consistently high xG figures is likely to be unlucky rather than structurally poor. Their underlying performance warrants more optimism than the raw results suggest.
Assessing goalkeeper and striker performance. A goalkeeper consistently saving shots with a combined xG well above the goals they concede is outperforming expectation — a trend that tends to regress over time. Similarly, a striker converting chances at twice their expected rate is likely benefiting from finishing variance rather than sustained elite skill.
Spotting line movement value. When odds for a match are shaped by recent results rather than underlying performance data, the gap between market perception and xG-based analysis can represent genuine analytical opportunity for informed fans and researchers.
Comparing teams across competitions. Because xG is based on shot quality rather than raw goal tallies, it allows more meaningful comparison between teams playing in different leagues or at different stages of a tournament.
Common Mistakes When Interpreting xG Data
Even experienced analysts fall into traps when working with expected goals. Here are the most important ones to avoid:
Treating xG as definitive after one match. A single game is too small a sample for xG to be statistically meaningful. One moment of individual brilliance — a Rabona from distance or a goalkeeper parrying a routine effort — can skew a match's xG dramatically. Look for patterns across at least five to ten matches before drawing firm conclusions.
Ignoring context behind the numbers. An xG of 2.5 built entirely on low-quality shots from outside the box tells a very different story than an xG of 2.5 built on six clear-cut penalty-area chances. Always look at how the xG was generated, not just the total figure.
Confusing xG with xGOT (on target). Some platforms display xGOT — expected goals on target — which filters only shots that actually tested the goalkeeper. This is a different and often more refined metric. Know which figure you are reading.
Overlooking non-shot xG (npxG). Most serious models strip out penalties to produce a non-penalty xG figure (npxG), since penalties are heavily influenced by referee decisions rather than open-play chance creation. Using raw xG that includes penalties can distort team comparisons, particularly when one side has been awarded several spot kicks.
Using xG in isolation. Expected goals works best as part of a wider statistical picture that includes pressing metrics, defensive line data, possession value models, and historical head-to-head context. On Betiball, we combine xG with a full suite of match data to give our users the most complete analytical foundation possible.
Betiball does not accept bets. All examples are for educational purposes only.
Conclusion: xG Is One of Football's Most Powerful Analytical Lenses
Understanding what xG in football really means — and how to apply it correctly — gives you a significant edge in how you read the game. It shifts your focus from raw scoreboards to the quality of underlying performance, revealing which teams are genuinely strong and which are merely riding a wave of short-term fortune. Whether you are analysing a single match or building a long-term picture of a team's trajectory, expected goals explained simply comes down to one core idea: not all shots are equal, and the numbers now exist to tell us exactly how unequal they are. We built Betiball to make that kind of rigorous, data-driven analysis accessible to every serious football fan — and xG sits right at the heart of that mission.
Read more:
- How to Use the Football Favourites Feature on Betiball
- Football Statistics for Beginners: Key Numbers That Matter


Your feedback helps us deliver better football betting insights.