Account
 Language
 Time Zone
 COEF
COEF


Possession Percentage in Football: What It Means và Who Wins
Learn what possession percentage in football really means, how it's calculated, and whether it predicts results. Explore more on Betiball.



If you've ever watched a match and heard a commentator say "City are dominating with 68% possession," you've already encountered one of football's most cited — and most misunderstood — statistics. Understanding what is possession percentage football actually measures, and more importantly what it doesn't, is essential for any serious analyst or bettor trying to read a game beyond the scoreline. At Betiball, we track possession data across dozens of leagues and use it as one layer in a broader statistical picture. In this guide, we break down exactly how it works, what it tells you, and where it can mislead you.

What Is Possession Percentage in Football?
Ball possession in football refers to the share of total playing time during which one team controls the ball. The ball possession meaning in a statistical context is straightforward: if Team A holds the ball for 54 minutes of a 90-minute game and Team B holds it for 36 minutes, Team A's possession percentage is 60% and Team B's is 40%.
The calculation itself is simple:
Possession % = (Time team holds ball ÷ Total ball-in-play time) × 100
Data providers such as Opta, StatsBomb, and Wyscout calculate possession using touch sequences — a new possession period begins every time the ball changes from one team to the other, either through a pass, tackle, interception, or set piece. Dead-ball time (throw-ins waiting to be taken, goal kicks being set, substitutions) is excluded from the calculation, which is why possession percentages always sum to 100% between the two teams.
It's worth noting that possession is not the same as territory. A team can hold the ball predominantly in its own half — recycling possession through the centre-backs and goalkeeper — and still register a high possession figure. Context always matters when interpreting the raw number.

How Possession Data Is Captured and Reported
Modern possession tracking has become highly sophisticated. Early systems relied on manual video tagging, but today's data pipelines combine optical tracking cameras (typically 8–16 cameras installed around stadiums), semi-automated image recognition, and human quality-control reviewers. Elite leagues such as the Premier League, La Liga, and the Bundesliga use player-tracking systems that record positional data at 25 frames per second, enabling extremely granular possession timelines.
For bettors and analysts using platforms like ours, the key outputs are:
- Overall possession % — the headline figure for a full match
- First-half vs second-half splits — revealing how games shift tactically after half-time
- Territorial possession — what proportion of touches occur in the final third
- Pressing phase possession — how quickly a team regains the ball after losing it
At the season level, aggregated possession averages reveal a team's tactical identity. A side averaging 58%+ possession across 30+ games is almost certainly operating a structured build-up system, while a team averaging below 42% is likely set up to defend and counter.
A Numeric Example: Reading Possession Stats Before a Match
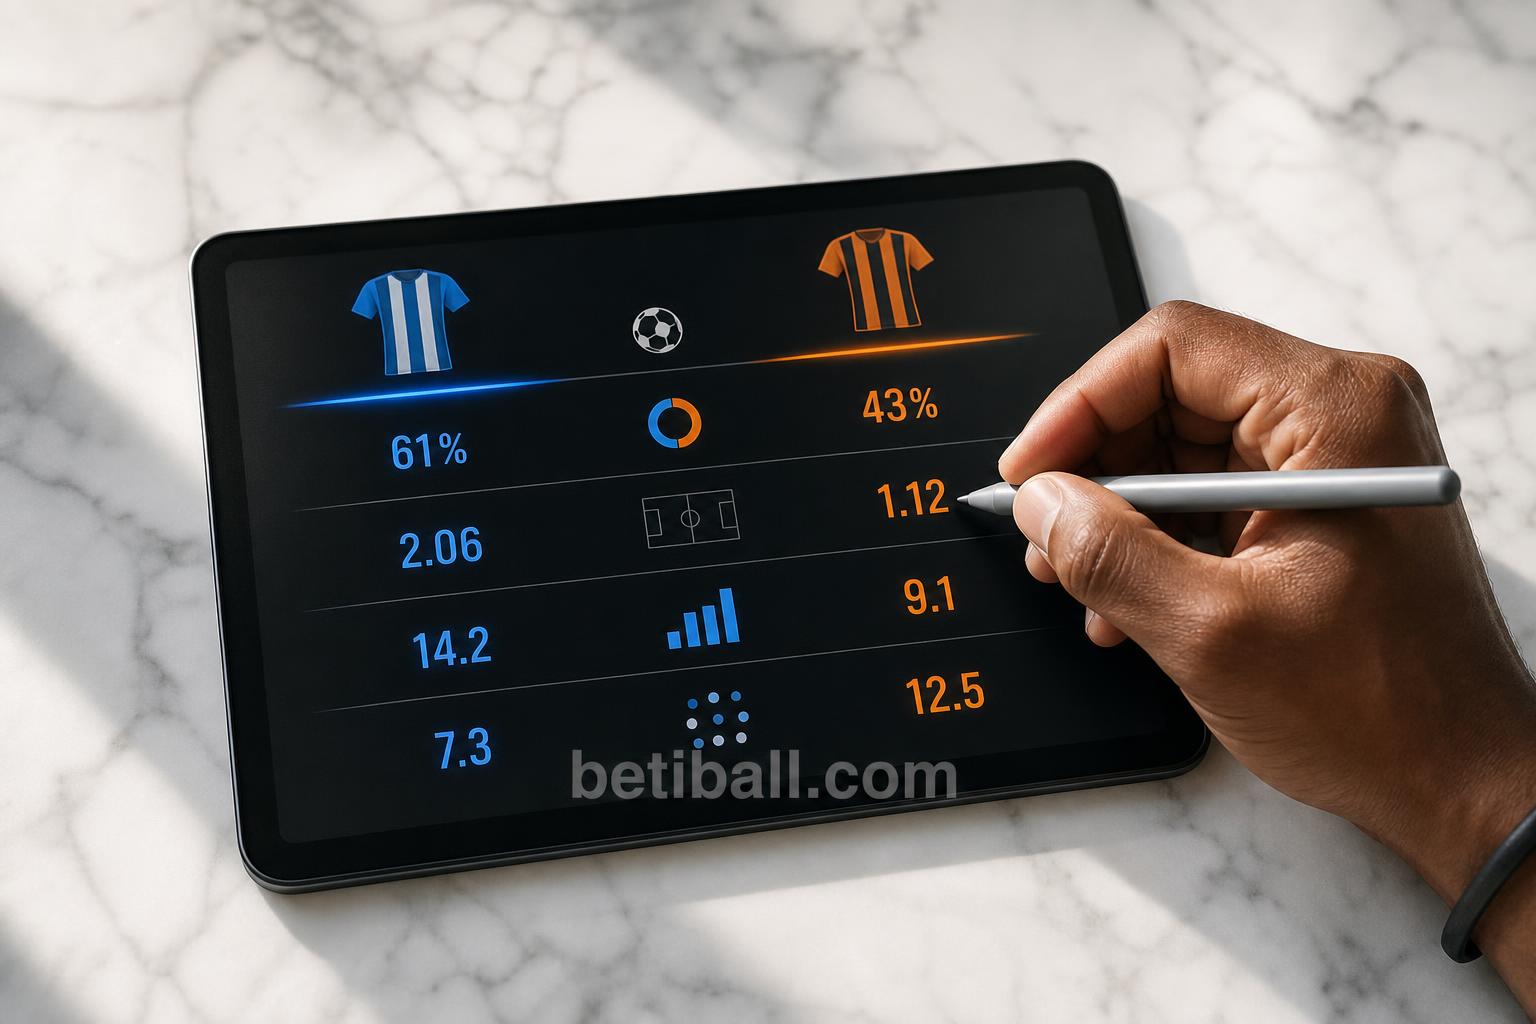
Let's walk through a realistic scenario. Suppose you are analysing an upcoming fixture between a high possession team — averaging 61% across the season — and a mid-table side averaging 45%. On paper, the possession-heavy team looks dominant. But before drawing conclusions, layer in the following questions:
- What is their possession converting to in terms of Expected Goals (xG)? If the high-possession team generates only 1.3 xG per game despite 61% possession, their dominance is largely non-threatening — they are likely circulating the ball in safe zones rather than creating danger.
- How does the mid-table side perform when they hold less possession? Many counter-attacking teams are actively more dangerous with lower possession. A team averaging 43% possession but 1.7 xG per game is efficient, not passive.
- Where is possession being won and lost? Check each team's PPDA (Passes Allowed Per Defensive Action) to understand whether the high-possession side is genuinely pressing or simply recycling in deep areas.
This layered approach — possession as a starting point, not a conclusion — is central to how we structure team analysis reports on Betiball.
Does Possession Actually Win Football Matches?
This is the central question that analysts and bettors debate constantly: does possession win games? The honest answer, backed by data, is: sometimes — and it depends heavily on how that possession is used.
Research across five Premier League seasons (2018–2023) consistently shows that teams with higher possession win more often on average, but the correlation is weaker than most casual observers assume. The correlation coefficient between possession % and points per game across Premier League teams typically sits around r = 0.55–0.65, meaning possession explains roughly 30–42% of the variance in results. That is meaningful — but it also means more than half of the outcome variance comes from other factors.
A few landmark findings that shape our thinking at Betiball:
- Teams that score first tend to gain possession afterward — meaning possession can be a consequence of leading rather than a cause of winning. The losing team chases the game, the leading team holds the ball.
- Counter-attacking teams systematically outperform their possession numbers. Atletico Madrid under Diego Simeone won La Liga titles with seasonal averages below 47% possession. Leicester City's 2015/16 Premier League winning side averaged approximately 44%.
- High possession + low shot conversion = vulnerable to upset. Teams that dominate the ball but lack clinical finishing are persistently exposed to low-block, counter-punch opponents — a pattern that creates excellent value opportunities for informed bettors.
The practical takeaway: use possession as a directional signal of team style, not a predictive shortcut for match outcomes.
Common Mistakes When Using Possession Stats for Match Analysis
Even experienced analysts fall into predictable traps when applying possession data. Here are the most damaging errors we see — and how to avoid them:
1. Treating possession in isolation. Possession without xG, shot quality, and press intensity data is like reading one chapter of a book and summarising the plot. Always combine it with at least two other output metrics before forming a view.
2. Ignoring game-state effects. As noted above, possession figures are skewed by scorelines. A team that conceded in the 20th minute and finished with 55% possession may have only controlled the ball from minute 21 onward because they were chasing. Always check when goals were scored relative to possession phases when available.
3. Assuming high possession means high pressing. These are distinct strategies. Barcelona's tiki-taka possession was rooted in positional play and short combinations. Gegenpressing sides like Klopp-era Liverpool won the ball back quickly but did not always dominate possession over 90 minutes. Know which system you're looking at.
4. Over-indexing on a single match sample. One game's possession figure can swing dramatically based on red cards, injuries, weather, or a fluke early goal. Use rolling 5-game or seasonal averages for reliable signal. Betiball displays rolling possession averages in all team profile pages for precisely this reason.
5. Ignoring the opposition's defensive shape. A team may record 65% possession because their opponent deliberately sat in a low block and invited it. That possession figure says as much about the defensive strategy of the other team as it does about the attacking quality of the possessing side.
Betiball does not accept bets. All examples are for educational purposes only.
Conclusion: Use Possession as Context, Not a Verdict
Possession percentage is one of football's most visible statistics and one of its most frequently misapplied. When used correctly — in combination with xG, PPDA, territorial splits, and game-state context — it provides a genuine window into a team's tactical identity and match dynamics. When used alone as a predictor of results, it will mislead you as often as it guides you.
At Betiball, we integrate possession data into multi-variable team profiles that account for style, form, opposition strength, and game-state history. Whether you are researching a specific fixture or building a deeper understanding of a team's season-long tendencies, possession is where many analysts start — but it should never be where the analysis ends.
Read more:

Your feedback helps us deliver better football betting insights.