Account
 Language
 Time Zone
 COEF
COEF


How Football Player Performance Rating Explained: What the Numbers Mean
Understand football player performance rating explained — how scores are calculated, what they measure, and how to use them smarter. Explore more on Betiball.



If you've ever looked at a post-match report and wondered why one midfielder scored a 7.8 while another got a 6.1 despite both playing the full 90 minutes, you're asking exactly the right question. Understanding football player performance rating explained in full detail is one of the most underrated skills a serious bettor can develop. At Betiball, we use player rating data as a core input in our match analysis, and in this guide we walk you through exactly how these systems work, what they actually measure, and how to apply them intelligently when evaluating upcoming fixtures.

What Is a Football Player Performance Rating?
A football player performance rating is a single numerical score — typically expressed on a scale from 1.0 to 10.0 — that attempts to quantify how well an individual player performed during a match. These scores are generated by data providers such as Sofascore, WhoScored, and Opta, each using a proprietary algorithm that weighs dozens of on-ball and positional actions against expected standards for that role.
The concept of a player rating system in football is not new — print media used subjective ratings from journalists for decades — but modern algorithmic ratings replaced editorial opinion with statistical modelling some time in the 2000s. Today's systems process hundreds of data points per player per game, creating a more consistent and repeatable measure than any individual journalist could provide.
It is important to understand that no two providers calculate ratings identically. A player rated 7.6 on Sofascore may receive a 7.1 on WhoScored for the same performance. That gap is not an error; it reflects different methodological choices about which actions to reward and by how much. When we reference player rating data at Betiball, we cross-reference multiple sources rather than relying on any single score.

How Player Rating Systems in Football Actually Work
Understanding how player ratings work requires looking under the hood of the algorithm. While each provider guards the exact weights used, the general framework is broadly consistent across the industry. Every on-ball action a player makes is logged: passes attempted and completed, shots on and off target, dribbles, tackles, interceptions, aerial duels, fouls committed, and key passes, among others. Each action carries a positive or negative value depending on whether it helped or hurt the team's probability of winning.
Several additional factors modify the base score:
- Role context: A central defender is not expected to register assists, so a completed long-range pass that leads to a chance boosts his rating disproportionately. A striker who attempts zero shots in 90 minutes will be penalised even if his pass completion was high.
- Volume and position: Defensive midfielders naturally accumulate more actions than wide forwards. Systems normalise for this to avoid inflating ratings purely through high touch counts.
- Match context weighting: Some systems apply a multiplier for actions in high-leverage moments — a tackle won in the 88th minute protecting a one-goal lead carries more algorithmic weight than the same tackle in the 12th minute of a 0-0 game.
- Opponent quality: More advanced models adjust ratings based on who the action was performed against. Completing 85% of passes against a low-block League One side is weighted less favourably than the same completion rate against a high-pressing Champions League opponent.
The Sofascore rating explained follows this general logic but also incorporates a proprietary "event impact" model that scores the value of every event in real time. Positive events — progressive carries, successful dribbles past opponents, accurate through balls — build the score upward. Negative events — misplaced passes in dangerous areas, fouls in the penalty box, dispossessions — drag it down. A goalkeeper's rating is calculated separately, focusing on saves made versus expected goals faced rather than outfield metrics.
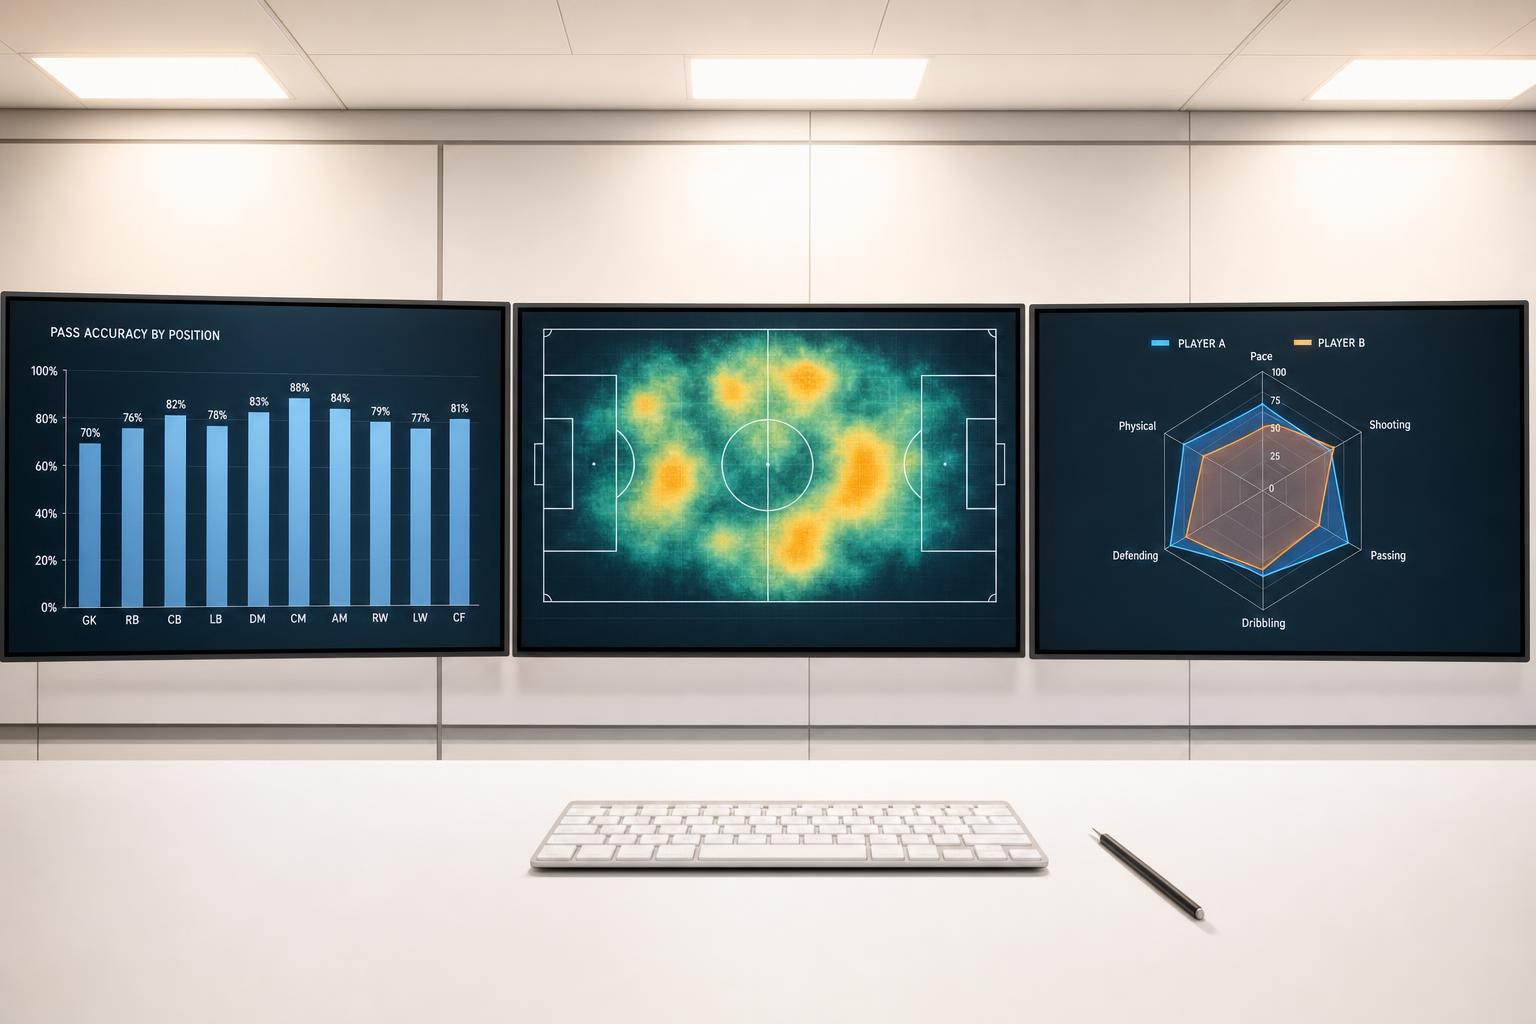
A Numeric Example: Reading a Rating the Right Way
Let's walk through a practical illustration. Consider two central midfielders in the same match:
- Player A: 97 touches, 88% pass completion, 3 key passes, 4 ball recoveries, 1 goal scored — final rating: 8.4
- Player B: 61 touches, 79% pass completion, 1 key pass, 2 ball recoveries, 0 goals — final rating: 6.3
On the surface, Player A's rating makes obvious sense. But the useful analytical layer is asking why Player B rated so poorly despite a decent touch count. Digging into the underlying data, you might find Player B gave the ball away three times in his own half, was dribbled past twice, and committed a foul that led to a free kick in a dangerous position. None of those actions show up in headline stats, but the algorithm captured every one of them.
This is the practical value of using player ratings rather than surface-level box score statistics. A midfielder's pass completion percentage tells you one dimension. The composite rating compresses dozens of dimensions into a single number — imperfectly, but usefully.
At Betiball, when we analyse a team's recent form, we track average player ratings over rolling five-match windows rather than single-game scores. A player rated 7.8 in one match means far less than a player who has averaged 7.4 across five consecutive away fixtures — that trend is far more reliable as an input into a pre-match model.
When to Use Player Ratings in Your Analysis
Player ratings are one tool in a broader analytical toolkit. Here is how we recommend structuring their use:
- Team form analysis: Aggregate the starting XI's average ratings from their last three to five matches. A team with multiple players trending below 6.5 is often carrying form problems that won't show immediately in the win-loss record.
- Key player availability: When a consistently high-rated player is suspended or injured, their absence creates a measurable performance gap. If a team's primary creator has averaged 7.9 over ten games and misses the next fixture, historical data consistently shows a significant drop in expected goals created.
- Head-to-head player matchups: In top-of-the-table clashes, looking at how specific players have rated against elite opposition (rather than their overall season average) gives you a sharper read of likely influence on the game.
- Over/Under and BTTS markets: Teams with multiple forwards rated highly over recent matches tend to overperform expected goals. This correlation, while not deterministic, is statistically meaningful over large samples.
Common Mistakes When Interpreting Player Ratings
Even experienced analysts fall into predictable traps. Here are the ones we see most often:
1. Over-indexing on a single match score. A 9.0 from a player who scored a hat-trick against a bottom-half side tells you little about their quality level. One game is noise. Five to ten games is signal.
2. Ignoring positional norms. A goalkeeper rated 7.2 after making eight saves in a 0-0 draw might actually be underperforming if their team was completely dominant — that many saves suggests defensive fragility. A striker rated 6.8 who scored once might have been exceptional if their team created only two clear chances all game.
3. Comparing ratings across different providers without acknowledging the methodology gap. If you are building a model, commit to one provider's data for consistency. Mixing Sofascore and WhoScored scores in the same dataset introduces systematic distortions.
4. Treating ratings as predictive in isolation. Player ratings measure past performance. Fatigue, travel, tactical changes, and head-to-head dynamics are not baked into a historical average. Always combine rating trends with contextual match intelligence.
5. Dismissing low-rated players who fill invisible roles. Pressing volume, positional discipline, and off-ball movement are still incompletely captured by most rating algorithms. A defensive midfielder rated 6.4 who disrupts 14 press recoveries may be undervalued by the algorithm while being tactically invaluable to his manager.
Betiball does not accept bets. All examples are for educational purposes only.
Conclusion
Football player performance ratings are powerful analytical shortcuts when used correctly and dangerous oversimplifications when used lazily. Understanding the mechanics behind the numbers — what actions they capture, how they normalise for position and context, and where their blind spots are — transforms them from a casual talking point into a genuine edge in your pre-match analysis process. At Betiball, we integrate multi-source player rating data alongside expected goals, defensive line statistics, and head-to-head trends to build the most complete picture possible of each upcoming fixture. The next time you see a match preview with player ratings attached, you now have the framework to read those numbers with the depth they deserve.

Read more:

Your feedback helps us deliver better football betting insights.